
ELECTROCARDIOGRAPHY
Twelve leads are routinely used to record the body surface ECG: three bipolar limb leads labeled I, II, and III; three augmented limb leads labeled aVR, aVL, and aVF; and six chest leads labeled V1 through V6 (Fig. 7.1). In the bipolar limb leads, the negative pole for each of the leads is different. The chest leads are often referred to as “unipolar leads” because the negative pole is constant. It is created by the left arm, right arm, and left leg electrodes connected together to form a single lead that is referred to as the Wilson central terminal. The positive chest lead is an exploring lead that can be placed anywhere. In children, the routine ECG often includes leads placed on the right side of the chest in positions referred to as V3R and V4R. Similar right-sided chest leads are often used in adults to diagnose right ventricular infarction, and one or more leads placed on the back are sometimes used to diagnose posterior wall infarction.
The chest leads are relatively close to the heart and are influenced by
the electrical activity directly under the recording electrode. This is in contrast
to the limb leads in which the electrodes are placed outside of the body torso.
Changes in the position of an individual chest lead or the relationship between
the chest leads and the heart may cause significant changes in the ECG pattern.
For instance, if the patient is in a sitting rather than a supine position, the
relationship of the various chest leads to the heart will change, and the ECG
waveform recorded by the chest leads could be altered. Similarly, if a chest
lead is placed an interspace too high or too low, the ECG waveform recorded by
that lead will change. For this reason, it is important that lead placement be
consistent and reproducible when serial ECGs are recorded. In contrast, limb
leads may be placed anywhere on the various limbs with little significant alteration of the ECG waveform. However, placing
the limb leads on the body torso,
which is often done during exercise testing and when patients are monitored in
critical care areas, will affect the recorded waveform.

FIG 7.1 ECG leads and reference lines.
ELECTROCARDIOGRAPHIC WAVEFORM
The ECG waveform consists of a P wave, a PR interval, the QRS complex, an
ST segment, and T and U waves. The relationship of these waveform components to
the underlying action potentials of the various cardiac tissues and an example
of normal 12-lead ECG are shown in Figs. 7.2A and 7.2B, respectively. The P
wave reflects depolarization of the atria, the QRS complex reflects
depolarization of the ventricles, and the ST segment and T wave reflect
repolarization of the ventricles. The U wave occurs after the T wave and is
believed to be an electromechanical event coupled to ventricular relaxation.
Depolarization of the sinus node occurs before the onset of the P wave,
but its voltage signal is too small to be recorded on the body surface by clinically
used ECG machines, and the event is electrocardiographically silent. Similarly,
the electrical activity of the atrioventricular (AV) node and the His-Purkinje
system, which occur during the PR interval, is electrocardiographically silent.
P Wave
The P wave is caused by the voltage gradients created as the atrial cells
sequentially depolarize. The shape and duration of the P wave are determined by
the sequence of atrial depolarization and the time required to depolarize the
cells of both atria. The sinus node is located at the junction of the superior
vena cava and the right atrium, and the direction of atrial depolarization
during sinus rhythm—from right to left, from superior to inferior, and from
anterior to posterior—reflects this geography. This results in a P wave that is
characteristically upright or positive in leads I, II, aVL, and leads V3
to V6 (the leads in which the positive electrode is placed on the
left side of the body), and inverted or negative in lead aVR (the lead in which
the positive electrode is placed on the right side). In lead V1, the
P wave may be upright, biphasic, or inverted. The amplitude and duration of the
normal sinus P wave may be affected by atrial hypertrophy and/or dilation and
by slowing of interatrial and intraatrial conduction.
Impulses arising from an ectopic atrial focus are associated with P waves
whose shape depends on the location of the focus. If the abnormal focus is
located close to the sinus node, the sequence of atrial activation will be
normal or nearly normal, and the P wave will resemble the normal sinus P wave.
The more distant the ectopic focus is from the sinus node, the more abnormal
will be the sequence of atrial activation and the configuration of the P wave.
For instance, impulses originating in the inferior portion of the atrium or
within the AV node will depolarize the atria in a retrograde, superiorly
oriented direction and will be
associated with the P waves that are inverted in leads II, III, and aVF and upright in lead aVR (Fig. 7.3).
 |
FIG 7.2 (A) Relation of action
potential from the various cardiac regions to the body surface ECG. (B) Normal ECG.
|
FIG 7.3 Ectopic atrial rhythm. |
PR Interval
The PR interval extends from the onset of the P
wave to the onset of the QRS complex and includes the P wave and the PR segment
(the segment from the end of the P wave to the onset of the QRS), which consist
of atrial repolarization and depolarization of the AV junction, which, in turn,
includes the AV node, the common His bundle, the two bundle branches (left and
right) and the Purkinje fiber network. AV conduction is prolonged and may be
blocked by factors that slow AV nodal conduction, such as a decrease in
sympathetic tone or an increase in vagal tone, drugs that have these effects
(e.g., digitalis and the β-adrenergic blocking agents), electrolyte
abnormalities (e.g., hypokalemia), ischemia, and a variety of infectious,
inflammatory, infiltrative, and degenerative diseases that affect the AV
junction. As a result, the PR interval will be prolonged, or in severe cases
when AV conduction or positive in
leads I, V5, and V6, the left-sided and more posterior leads, and negative or inverted in leads aVR
and V1, the right-sided and more anterior leads. It is only in
situations such as right bundle branch block and significant right ventricular
hypertrophy that the electrical activity associated with right ventricular
depolarization is identified on the ECG.
The QRS complex is altered in both shape and duration by abnormalities in
the sequence of ventricular activation. These include the bundle branch blocks
(Fig. 7.4A), the fascicular blocks, ventricular preexcitation (Fig. 7.4B),
nonspecific intraventricular conduction disturbances, and ventricular ectopic
beats (Fig. 7.4C). The increase in QRS duration may range from a few
milliseconds, as in the case of fascicular blocks, to >40 ms, as with bundle
branch blocks. The fascicular blocks reflect conduction slowing in one fascicle
of the left bundle and are characterized by a shift in the electrical axis and
subtle changes in the initial portion of the QRS complex. Bundle branch blocks
on the ECG reflect conduction slowing or interruption in the right or left
bundle branch, and are usually caused by fibrosis, calcification, or congenital
abnormalities involving the conducting system. They are associated with more
pronounced abnormalities in the sequence of ventricular activation than are the
fascicular blocks, and thus, with more significant changes in the QRS
configuration. Intraventricular conduction abnormalities may also occur without
a change in QRS configuration and reflect slow
conduction without a change in the sequence of activation. Such slowing may be caused by cardioactive
drugs, an increase in extracellular potassium concentration, and diffuse
fibrosis or scarring, which may occur in patients with severe cardiomyopathies.
 |
FIG 7.4 (A) Left bundle branch block. (B)
Ventricular preexcitation. (C) Ventricular premature beats. (D) ECG changes of left ventricular (LV)
hypertrophy.
The ECG criteria for the diagnosis of intraventricular conduction disturbances have been published. Important features include the following:
· The fascicular blocks, by altering the initial
portion of the QRS complex and the electrical axis in the frontal plane, may
obscure the diagnosis of a previous myocardial infarction (MI) while causing
other changes that can simulate an infarction.
· Right bundle branch block does not affect the
initial portion of the QRS complex, because activation of the interventricular
septum and the left ventricle are unaffected. Thus the ECG changes of a
previous MI or left ventricular hypertrophy can still be appreciated.
· Left bundle branch block and ventricular
preexcitation do affect the initial portion of the QRS complex. Thus the ECG
changes associated with a previous MI and hypertrophy can be obscured, or as
frequently occurs with ventricular preexcitation, can be mimicked.
· Abnormalities in the sequence of depolarization
are always associated with abnormalities in the sequence of repolarization.
This results in secondary changes in the ST segment and T wave. This is
particularly prominent in the setting of left bundle branch block and
ventricular preexcitation (see Figs. 7.4A and 7.4B).
· Changes in intraventricular conduction may be
rate dependent and present only when the rate is above a critical level or
after an early atrial premature beat. In this situation, it is referred to as
rate-dependent aberrant ventricular conduction.
· The shape and duration of the QRS complex of
ectopic ventricular beats and of paced ventricular beats will be influenced by
the site of the ectopic focus or the location of the pacemaker just as the
shape and duration of atrial ectopic beats are influenced by their site of
origin.
The amplitude of the QRS complex is subject to a variety of factors,
including the thickness of the left ventricular and right ventricular walls,
the presence of pleural or pericardial fluid, or an increase in chest wall
thickness or body mass. QRS amplitude is also affected by age, sex, and race.
For instance, younger individuals have greater QRS voltages than older
individuals, and men have greater QRS voltages than women. In left ventricular
hypertrophy, the amplitude of the R wave in the left-sided leads (V5 and V6) and the S wave
in the right-sided chest leads (V1 and V2) are increased.
The duration of the QRS complex may increase, reflecting the increased
thickness of the left ventricle, and there may be changes in repolarization
that result in changes in the ST segment and the T wave (Fig.7.4D).
Right ventricular hypertrophy is more difficult to diagnose
electrocardiographically. Initially, it causes cancellation of left ventricular
forces, resulting in a decrease in S-wave amplitude in the right-sided leads V1
and V2 and a decrease in R-wave amplitude in the left-sided leads V5
and V6. With more advanced right ventricular hypertrophy, an
increased R wave occurs in the right-sided leads, and a deeper S wave is seen
in the left-sided leads. Pericardial and pleural effusions decrease QRS voltage
in all leads; infiltrative diseases such as amyloidosis may also do the same.
The ST segment and the T wave reflect ventricular repolarization. During
the ST segment, the ventricular action potentials are at their plateau voltage,
and only minimal voltage gradients are generated. For this reason, the ST
segment is at the same voltage level as (i.e., is isoelectric with) the TP and
PR segments, during which time the action potentials are at their resting
levels, and there are no voltage gradients. The T wave is caused by the voltage
gradients created as the ventricular cells rapidly and sequentially repolarize.
If the sequence of repolarization was the same as the sequence of
depolarization, the T wave would be opposite in direction to the QRS complex.
However, the sequence of repolarization is reversed relative to the sequence of
depolarization. As a result, the
normal T wave is generally upright or positive in leads with an upright or positive QRS complex (leads I, V5,
and V6), and it is inverted
or negative in leads with an inverted QRS complex (aVR and V1) (see
Fig. 7.2B).
Abnormalities in repolarization are manifested by elevation or depression
of the ST segment and changes in polarity of the T wave. As mentioned
previously, such changes may be secondary to intraventricular conduction
disturbances, or they may be due to primary changes in repolarization, which
occur as the result of electrolyte abnormalities or cardioactive drugs, or as
the manifestation of diseases such as hyper- trophy, ischemia, or myocarditis.
Changes in T-wave polarity that occur in the absence of QRS and ST-segment
changes are among the most difficult ECG abnormalities to interpret because
they are nonspecific and may result from a variety of nonpathological as well
as pathological causes. The following guidelines serve as an approach to
interpreting T-wave abnormalities:
- In
general, T-wave amplitude should be ≥10% of the QRS amplitude.
- Inverted
T waves in lead I are always abnormal and usually indicative of underlying
cardiac pathology.
- Minor
T-wave changes, such as T-wave flattening or slightly inverted T waves,
particularly when they occur in the absence of known cardiac abnormalities
or in populations at low risk for cardiac disease, are more likely to be
nonspecific and nonpathological than more marked T-wave changes or T-wave
changes that occur in the presence of cardiac disease.
- Flat or inverted T waves often occur in association with rapid ventricular rates and in the absence of other ECG changes. These changes are nonspecific and not indicative of underlying cardiac disease.
Elevation or depression of the ST segment indicates the presence of
voltage gradients during the plateau and/or resting phases of the ventricular
action potential and are most often a manifestation of cardiac disease. Among
the most common causes of ST-segment elevation are acute transmural ischemia
and pericarditis. High serum potassium and acute myocarditis may also cause
ST-segment elevation and simulate ischemia, although this is rare. A normal
variant referred to as early repolarization is a fairly common cause of ST
elevation, particularly in young males. These changes characteristically occur
in the V leads, involve elevation of the junction of the ST segment with the
end of the QRS complex, and may simulate acute ischemia or pericarditis.
Left ventricular hypertrophy, cardioactive drugs, low serum potassium,
and acute nontransmural or subendocardial ischemia are the most common causes
of ST-segment depression.
The U wave follows the T wave, or may arise within the terminal portion
of the T wave and be difficult to distinguish from a notched T wave. It is most
easily seen in leads V2 to V4 and its amplitude is
normally no more than one-third that of the T wave. An increase in U-wave
amplitude is frequently associated with hypokalemia (Fig.
7.5A) and with some direct-acting cardiac drugs. Notching of the T wave
resembling an increase in the U-wave amplitude and lengthening of the QT-U
interval can also occur in patients with congenital long QT syndrome (Fig. 7.5B).
 ECG changes associated with hypokalemia. (B) Congenital long QT syndrome.")
FIG 7.5 (A) ECG changes associated with
hypokalemia. (B) Congenital long QT syndrome.
The QT interval is measured from the onset of the Q wave to the end of
the T wave and is slightly longer in females than in males. Changes in the
duration of the QRS complex, the ST segment, and/or the T wave alter the QT
interval. The QT interval is rate dependent, reflecting the rate-dependent
changes in the duration of the action potential. It shortens at faster heart
rates and lengthens at slower rates. To accommodate this rate dependency,
several correction factors have been applied to the measured QT interval and
used to generate the corrected QT interval. The QT interval is also influenced
by a variety of other factors, including (but not limited to) temperature,
drugs, electrolyte abnormalities, neurogenic factors, and ischemia.
There is an extensive and ever-increasing list of drugs that lengthen the
QT interval by prolonging the ST segment or the T wave, and it is often necessary to monitor the ECG
when drugs recognized as having the
potential for lengthening the QT interval are initiated. This is clinically
important because lengthening of the QT interval after administration of these
drugs may be a harbinger of a specific type of ventricular tachycardia
(Torsades de pointes), which may progress to ventricular fibrillation.
Low serum potassium and low serum calcium are both associated with
prolongation of the QT interval. However, their ECG patterns are different and distinctive.
As mentioned previously, low potassium causes ST-segment depression, T-wave
changes, a prominent U wave, and prolongation of the QT-U interval (Fig. 7.6A),
whereas low calcium lengthens the ST segment, usually without causing
significant T-wave changes (Fig. 7.6A). Marked elevations in serum potassium
(usually >6.5 mM) may cause
prolongation of the QRS complex. Increases in serum potassium and in serum
calcium shorten the QT interval by shortening the ST segment. High potassium
also shortens the duration of the T wave and makes it more symmetrical, giving
it a tented or peaked appearance (Fig. 7.6B).
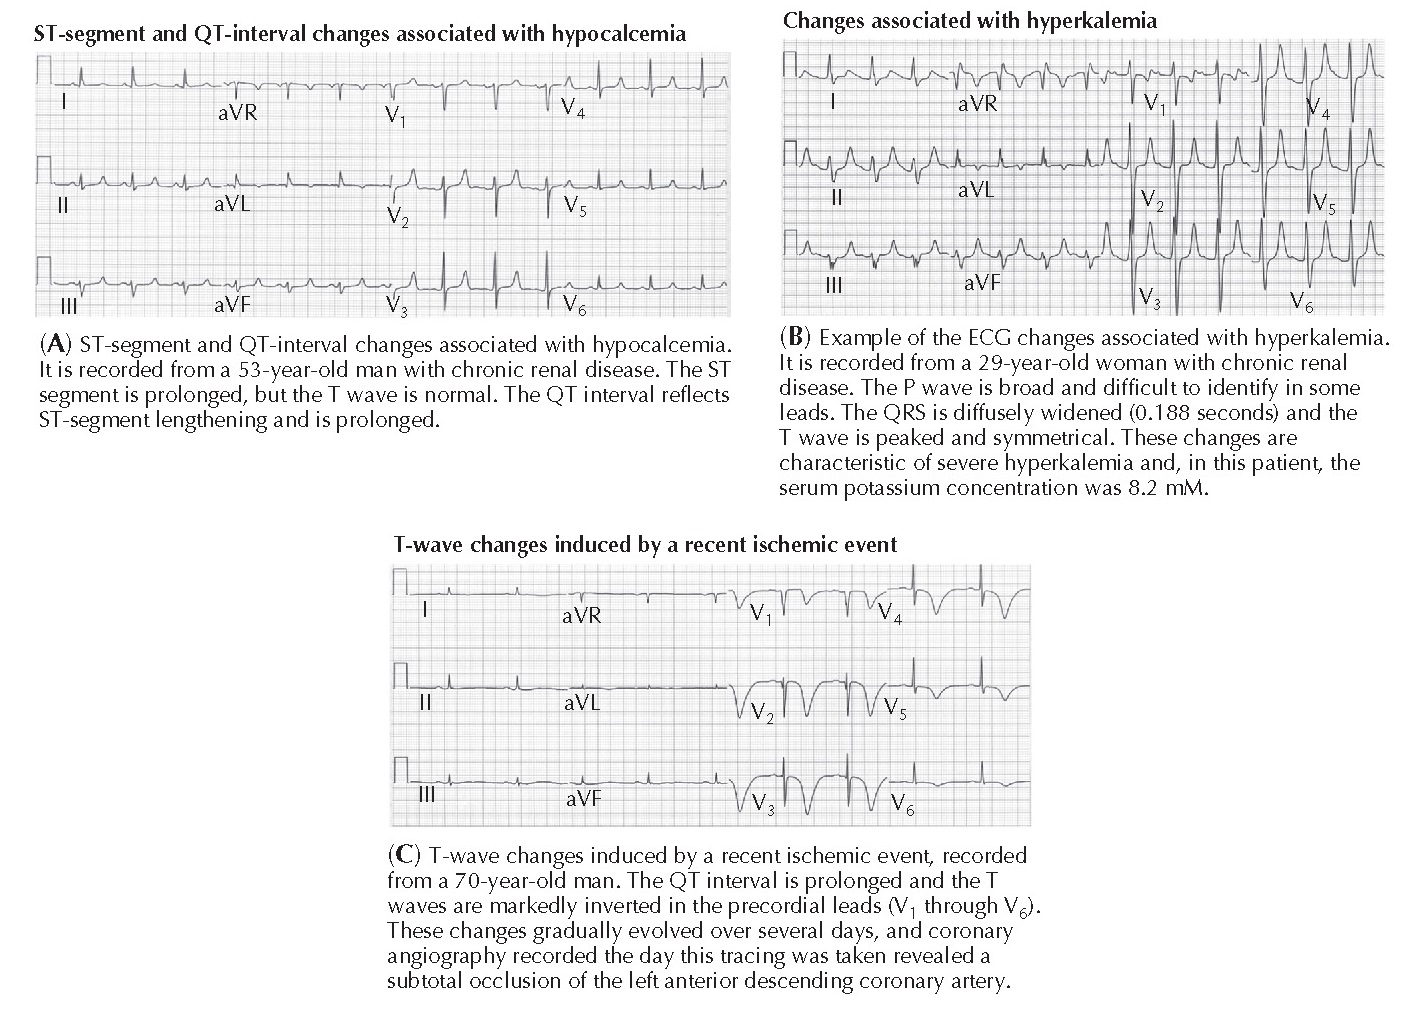 |
FIG 7.6
(A) Hypocalcemia. (B) ECG changes
associated with hyperkalemia. (C) T-wave changes induced by a recent ischemic event.
Abnormalities in one or more of the several genes that regulate the repolarizing currents are responsible for causing congenital long QT syndrome, a significant cause of ventricular arrhythmias that often lead to sudden cardiac death. The ECG changes associated with congenital long QT syndrome (see Fig. 7.5B) are often difficult to distinguish from those caused by low potassium (see Fig. 7.5A) and low calcium (see Fig. 7.6A).
Marked QT prolongation and deeply inverted T waves frequently occur
within the first several days after an acute MI, particularly when the MI is
due to occlusion of the left anterior descending coronary artery (Fig. 7.6C).
This QT prolongation usually resolves within several days, although the T-wave
inversion may persist for longer periods. Similar T-wave and QT-interval
changes may also occur in the chest leads after an acute ischemic event but in
the absence of an infarction. This particular ECG pattern usually indicates a
severely but not totally obstructed proximal portion of the left anterior
descending coronary artery.
Some neurological events, particularly intracranial hemorrhage and an
increase in intracranial pressure, may cause T-wave inversion and dramatic
lengthening of the QT interval, similar to that shown in Fig. 7.6C. When it
occurs in this clinical setting, it is called the cerebrovascular accident
pattern and is believed to represent an imbalance of sympathetic stimulation.
These ECG changes generally resolve within a
few days.
ACUTE ISCHEMIA AND INFARCTION
Acute myocardial ischemia and
infarction cause a series of metabolic, ionic,
and pathological changes in the region supplied by the occluded coronary artery
that cause characteristic changes in the ST segment, QRS complex, and T wave
(Fig. 7.7A). The recognition of these changes permits the early diagnosis and
prompt treatment—either thrombolytic therapy or percutaneous coronary
revascularization—that can reverse ischemia and prevent the loss of myocardial
cells and its sequelae.
The sequence of ECG changes associated with acute ischemia and infarction
is as follows: (1) peaking of the T wave; (2) ST-segment elevation and/or
depression; (3) development of abnormal Q waves; and (4) T-wave inversion.
Peaking of the T waves in leads overlying the ischemic region is the
earliest ECG manifestation of acute transmural ischemia and is transient. It is
infrequently seen because the ECG is usually not recorded early enough to
permit its detection unless the patient is in a hospital setting when ischemia
first begins. ST elevation and depression are the most frequently observed
early changes and develop within minutes of the onset of the acute event. The
ST changes are caused by voltage gradients across the
border between the ischemic and nonischemic regions that result in an
electrical current, referred to as an injury current, flowing across the
ischemic border. Whether these injury currents cause ST elevation or depression
depends on the extent and location of the ischemic zone and the relationship of
the ECG electrodes to the ischemic zone. In general, electrodes that directly
overlie a region of transmural
ischemia will record ST elevation, whereas all other electrodes will record ST depression or no change in the ST segment
(Fig. 7.7B).
 |
FIG 7.7
(A) Myocardial ischemia, injury, and
infarction. (B) ST- and T-wave segment changes associated with acute ischemic event.
|
FIG 7.8
(A) Atrioventricular (AV) nodal
reentrant tachycardia. (B) Atrial fibrillation. (C) Ventricular tachycardia. (D) Complete AV block. (E) Atrial premature beats. (F) Second-degree AV
block (type I). |
Subendocardial ischemia, such as that associated with subtotal coronary occlusion and which is often brought on by exercise in patients with flow-limiting coronary artery obstruction, does not extend to the epicardium. Thus none of the body surface leads lie directly over the ischemic region, and ST depression, rather than ST elevation, is recorded.
The development of abnormal Q waves indicates absent conduction through
the infarcted region and may last indefinitely. Abnormal Q waves that mimic
those associated with infarction may also occur in other settings, particularly
hypertrophy of the interventricular septum and intraventricular conduction
disturbances, most notably ventricular preexcitation.
The various ECG changes in the setting of an acute transmural ischemic
event permit localization and an estimation of the extent of the ischemic or
infarcted region and, by inference, identification of the occluded vessel.
ARRHYTHMIAS
The ECG is indispensable for the diagnosis of cardiac arrhythmias. For instance, abnormally rapid heart rates
(>100 beats/min) may have multiple causes, including sinus tachycardia,
atrial and AV nodal ycardia (Fig. 7.8A), atrial flutter and atrial fibrillation (Fig. 7.8B), and ventricular tachycardia (Fig. 7.8C). The correct
diagnosis is made by analysis of the rate and configuration of the P wave, its
relation to the QRS complexes, and the shape and duration of the QRS complex.
Abnormally slow heart rates (<50 beats/min) may also be caused by several
entities, including sinus bradycardia, or sinoatrial or AV block (Fig. 7.8D).
Again, the diagnosis can be established by noting the rate, regularity, and configuration
of the P wave and QRS complexes, the relation of the P wave to the QRS
complexes, and the PR interval.
Irregular rhythms may be due to atrial and ventricular premature beats
(Figs. 7.8E and 7.4C), atrial fibrillation with a slow ventricular response,
and incomplete (second-degree) sinoatrial or AV block (Fig. 7.8F).
SCREENING
The role of the ECG in the asymptomatic patient as a screening tool
remains the subject of debate. Some pathological conditions, such left
ventricular hypertrophy, the Wolff-Parkinson-White pattern (if antegrade
conduction down the accessory pathway is evident), long QT, Brugada pattern,
congenital complete heart block, and T-wave changes consistent with
hypertrophic cardiomyopathy or arrhythmogenic right ventricular cardiomyopathy
(ARVC) can be detected on a screening ECG. However, the specificity of the ECG
to detect such conditions is highly variable, and the use of ECG screening in
the general population, especially in asymptomatic individuals, raises
concerns. A 2012 report from the U.S. Preventive Services Task Force advised
against routine ECGs at rest or with exercise in asymptomatic low-risk subjects
as a screening for coronary heart disease. ECG screening in specific patient
groups may be more beneficial. The role of the ECG in preparticipation
screening of competitive athletes has generated much interest in the last
decade. Many of the conditions associated with sudden death in athletes, such
as long QT syndrome and ARVC, have distinct ECG findings. In athletes, the definition
of what is considered normal on a screening ECG continues to be refined. Areas
of continued investigation include the impact of age, race, sex, and the type
of training on normal variants on the
ECG.


.webp "SCROTAL SKIN DISEASES I : CHEMICAL AND INFECTIOUS")
