Axis
Deviation in Normal Electrocardiogram
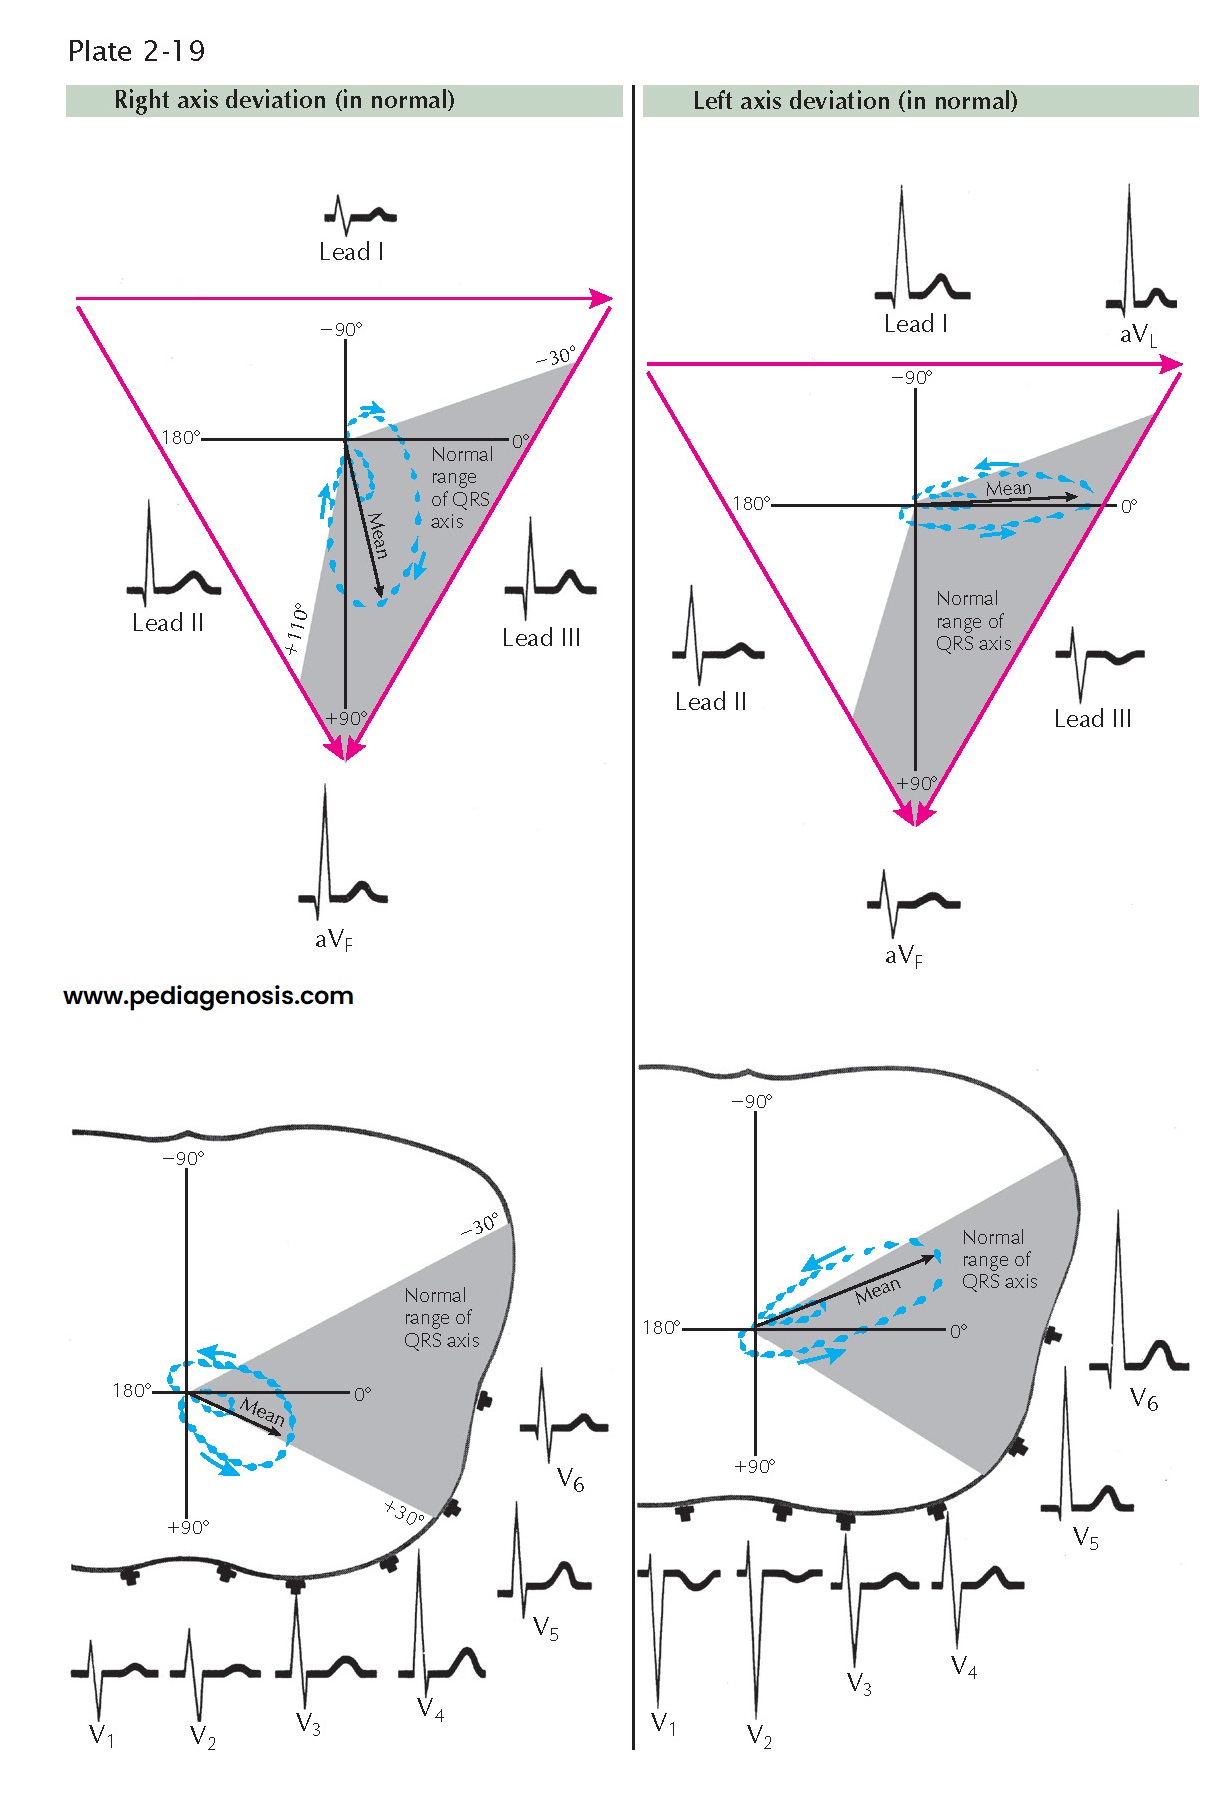
In the normal individual the mean electric axis of the P wave, QRS complex, and T wave often reflects the anatomic position of the heart in the chest; an abnormal axis can result from heart disease. Plate 2-19 illustrates normal variations in the vectorcardiographic loop. The QRS and T loops in the frontal plane vary between −30 and +110 degrees and in the horizontal plane between +30 and −30 degrees, measured from the left arm.
In right axis
deviation in the frontal plane, the P and QRS loops are directed toward the
right, often to +90 degrees. Electrocardiographically, there are tall R waves
in leads II, III, aVF, V2, and V3.
Left axis deviation
is characterized
by a QRS loop that points toward the left shoulder blade (left, up, and back). The
mean electric axis is often close to −30 degrees in the frontal plane and approaches
−30 degrees in the horizontal plane (toward the back). The S waves are deep in leads
V1 and V2, and the R waxes are tall in leads I, aVL,
V5, and V6.
It is important
to understand the relationship between the position of the heart in the chest and
the electrocardiogram because the heart’s position has a profound influence on the
tracing. The concept is complex; the heart can rotate around an anteroposterior
axis, a transverse axis, and an anatomic axis that runs from the base to the apex
of the heart. Actually, the heart can rotate from front to back, side to side, and
around the anatomic axis, all simultaneously. The rotation around the anatomic
axis is the most difficult to visualize. Rotation here consists of turning around
an axis that runs from the valvular base of the heart through the septum, finally
emerging from the apex. An observer at the left of a patient would see the emerging
axis at the apex of the heart. Then visualizing a clock at the base of the
heart, the observer could also visualize any rotational change around the axis and
could designate the direction of rotation as clockwise or counterclockwise.
In a patient with an intermediately placed heart, the right ventricle is in front, to the right, and superior to the left ventricle. The left ventricle is in back, below, and to the left of the right ventricle. Now, if an electrode were placed directly on the right ventricle, a “right ventricular complex” (small R, large S, inverted T) would be recorded. If an electrode were placed directly on the left ventricle, a “left ventricular complex” (small Q, large R, upward T) would be recorded. An electrode on the body or on a limb, facing one ventricle or the other, will record in the lead the type of complex that is typical of that ventricle. In the intermediate heart position, neither the right nor the left ventricle directly faces the aVL or aVF electrode; thus these leads have small complexes that do not look exactly as do the right or left ventricular complexes. With inspiration and the descent of the diaphragm, or in a patient with an asthenic body build, the heart rotates clockwise, causing the left ventricle to face the foot and the right ventricle to face the left arm. Thus, typical complexes of a left ventricular type will be recorded from lead aVF, whereas aVL will record complexes of a right ventricular type. In an obese or pregnant subject, or during expiration with a high diaphragm, the heart rotates counterclock-wise, and LV (predominantly positive) complexes are recorded in lead aV and RV (predominantly negative) complexes in lead aVF (see Plate 2-19).


