Specialized
Conduction System
PHYSIOLOGY OF SPECIALIZED CONDUCTION SYSTEM
PHYSIOLOGY OF SPECIALIZED CONDUCTION SYSTEM
Under normal conditions, heart activation results from an impulse originating in a cell or cell group (the pace-maker) and from the propagation of this impulse to all fibers of the atria and ventricles. Arrival of the electrical signal at the contractile fibers of the heart initiates contraction. Regular rhythmic activity requires the presence of specialized automatic fibers. Coordinated contraction of the atria and ventricles requires a system that distributes the electrical impulse to the muscle fibers of these chambers in the proper sequence and at the proper time. Both these functions are performed by specialized groups of cardiac fibers.
The automaticity
that underlies pacemaker activity is a unique property not only of the fibers in
the sinoatrial node but also of other groups of specialized atrial fibers and cells
of the His-Purkinje system. The conduction system is composed of the fibers of the
internodal tracts, Bachmann’s bundle, the atrioventricular node, the bundle of His,
the bundle branches, and the peripheral Purkinje fibers. The cells of the conduction
system, in addition to having a characteristic histologic appearance, possess unique
electrical properties. These properties, and the basis for electrical activity of
all cardiac fibers, can best be understood by recording the transmembrane potentials
through intracellular microelectrodes.
Basis for
Transmembrane Potentials
As with other excitable
mammalian tissues, cardiac cells have an intracellular ionic composition that differs
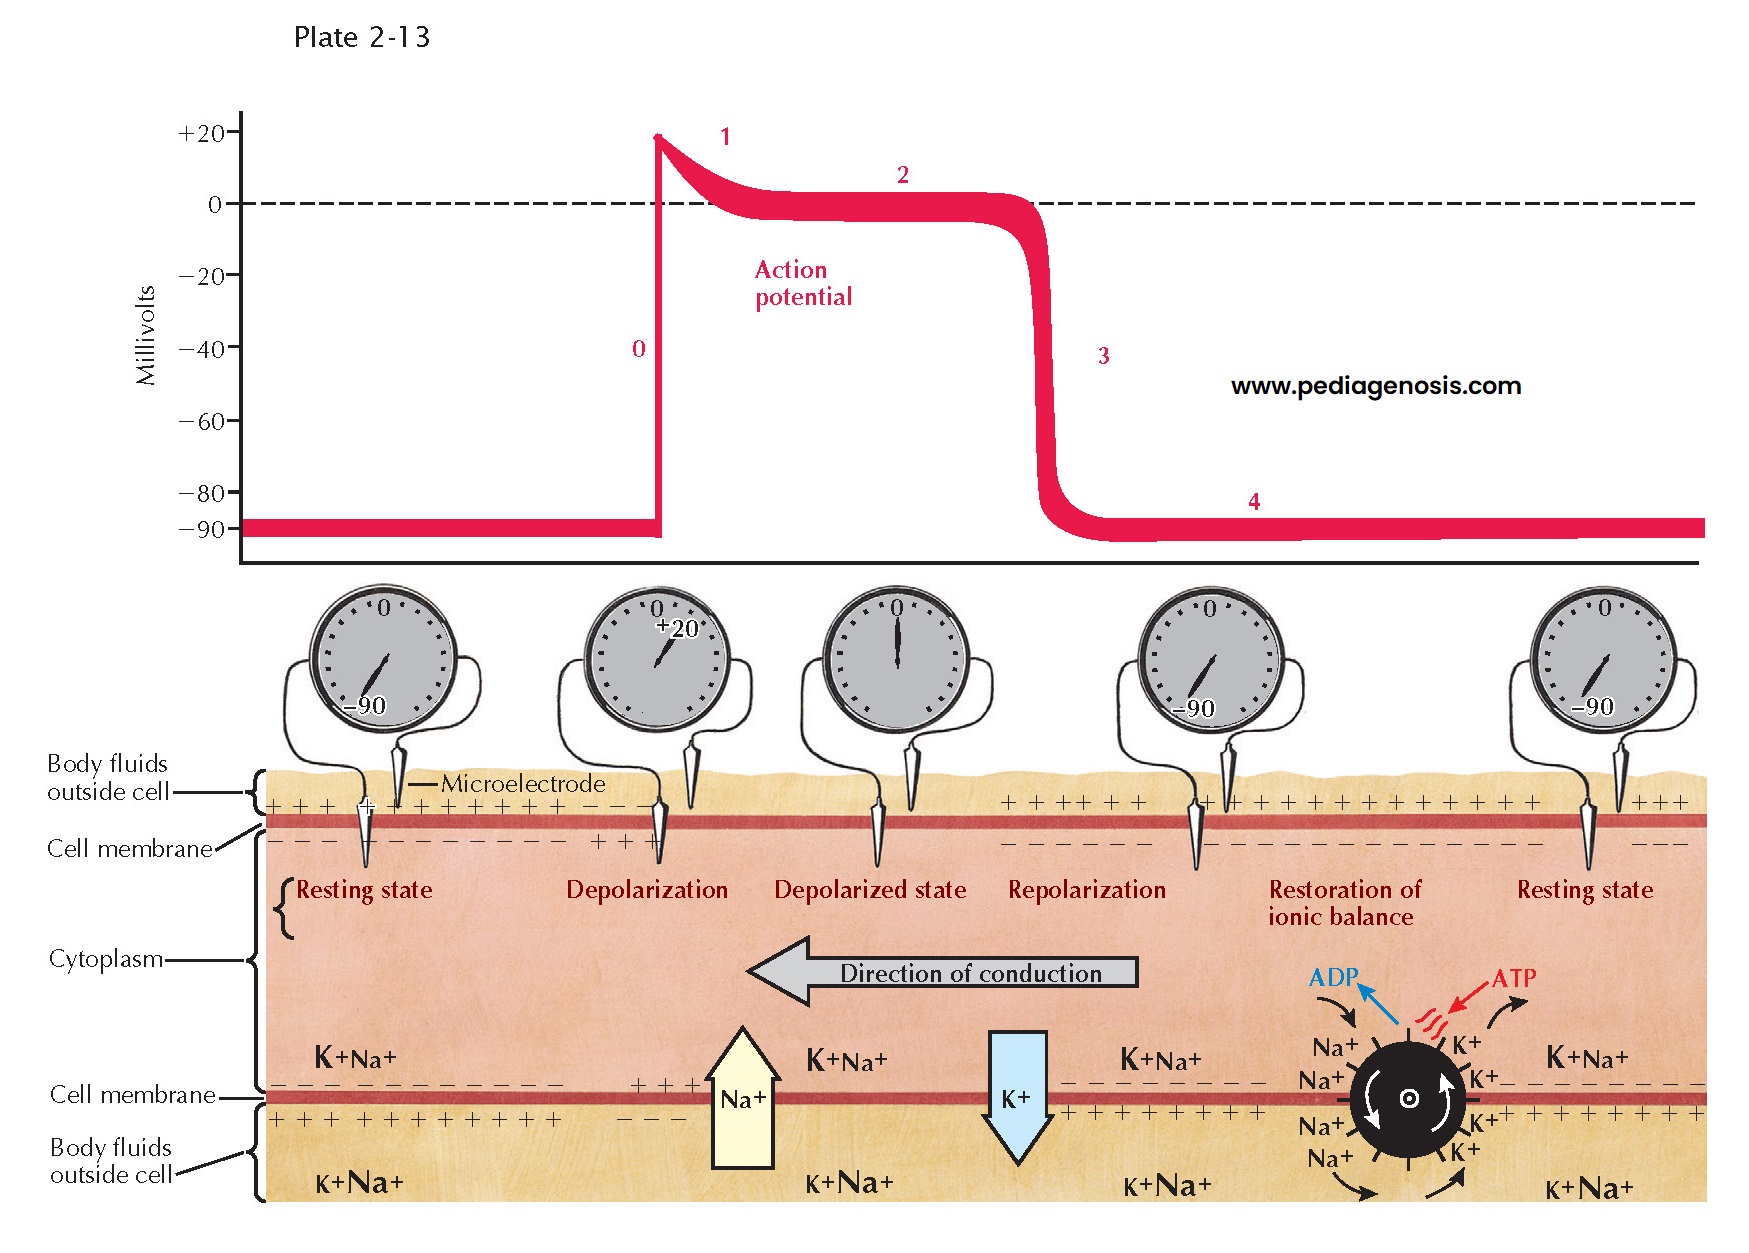
from that found in the extracellular fluids (see Plate 2-13).
For our consideration, the most important ions are sodium (Na+) and potassium
(K+). The relative magnitude of the concentration of these ions is
indicated by the sizes of the symbols in the illustration. Intracellular K+
concentration is approximately 30 times greater than the extracellular concentration,
whereas intracellular Na+ concentration is approximately 30 times less.
Because of this difference, and because the resting membrane is more permeable to
K+ than to Na+, the membrane of the resting fiber is
polarized. The magnitude of this polarization, the transmembrane resting potential,
can be measured by inserting a microelectrode inside the cell and measuring
the potential difference across the membrane. This is shown schematically both as
the recorded voltage (−90 mV) and as an oscilloscopic tracing.
With the onset of
excitation, there is a change in the permeability of the membrane that permits sodium
ions, carrying a positive charge, to move rapidly down their electrochemical gradient,
across the membrane, and inside the fiber. This sudden influx of positive charge
carried by Na+ actually reverses the transmembrane potential,
and the inside becomes 20 to 30 mV more positive than the outside. The inward Na+
current is represented by the large arrow in Plate 2-13;
the resulting change in transmembrane potential is shown as the upstroke (phase
0) of the oscilloscopic tracing. After excitation there is a period of variable
duration (phases 1 and 2) when the membrane potential remains close to zero. This
period, often described as the plateau of the transmembrane action potential,
results from a decrease in Na+ and K+ permeability. Subsequently,
repolarization, or restoration of the normal resting potential, takes place
because of an increase in K+ permeability and an efflux of K+
from the cells. The phase of rapid repolarization (phase 3) is followed by a
period of stable resting potential (phase 4) until the arrival of the next wave
of excitation. To maintain the normal concentration gradients for the sodium and
potassium ions, an active transport system, often referred to as a “pump,” must
extrude the sodium that has entered and pump in an equivalent amount of potassium.
The pump is represented by the wheel with gates.
Plate 2-13 is a
representation of a longitudinal section of a single fiber during propagation of
the impulse. The activity, conduction, is spreading from right to left. At
the extreme left of the tracing, the resting potential has not yet been changed
by the coming wave of excitation. At the right, repolarization is complete, and
the resting potential has been restored. In the middle of the figure, the current
flow associated with excitation is shown under the upstroke (phase 0) of the action
potential; the currents associated with repolarization appear under phase 3. The
relative magnitude and polarity of the transmembrane potential are suggested by
the plus and minus signs inside and outside the membrane. Propagation, or
the spread of the impulse, occurs because a change in transmembrane potential at
one point, during phase 0, causes a local longitudinal potential difference. This
produces a flow of current across the membrane in advance of the action potential
upstroke, resulting in excitation of the next adjacent segment of the fiber. During
propagation these processes are continuous, and thus activity spreads from its point
of origin throughout all excitable fibers.
ELECTRICAL ACTIVITY OF THE HEART
The previous description
applies in general to all cardiac fibers. However, records of transmembrane
action potentials recorded from cells in different parts of the heart show special
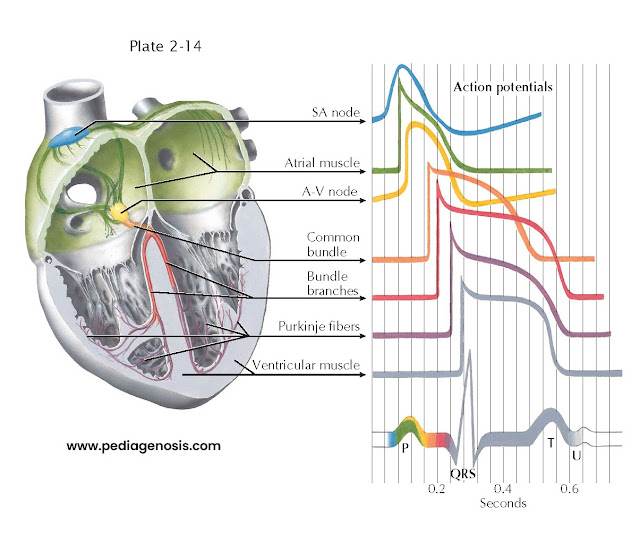
characteristics in the initiation and spread of the normal cardiac impulse (see
Plate 2-14).
This trace is recorded
from a single automatic fiber in the sinoatrial (SA) node. There is no steady resting
potential; instead, after repolarization the transmembrane potential decreases spontaneously.
This slow, spontaneous depolarization during phase 4 causes the
automatic activity of sinus fibers. A similar cause of automaticity has been recorded
from all the specialized cardiac fibers capable of normal pacemaker activity. Further, the rate of rise of
the upstroke of the action potential is slow, causing slow conduction of the impulse
within the node. The action potential recorded from an ordinary atrial muscle fiber
is shown below that from the SA node. Here the upstroke is rapid and the resting
potential steady.
Action
potentials recorded from fibers of the A-V node resemble those shown for sinus fibers.
The extremely slow spread of the impulse through the A-V node results largely from
the slow rate of rise of the action potential. The phase 4 depolarization shown
probably causes automatic activity only in fibers of the lower node in proximity
to the common bundle.
His-Purkinje
System
The action potentials
recorded from the fibers of this part of the specialized conduction system (Purkinje
fibers) have the following important characteristics:
•
The rate of rise of the action potential is fast, and thus conduction is rapid.
•
The duration of the action potential is great, and thus the refractory period
is long.
• Under appropriate conditions, each of these fiber groups (not shown) may develop
spontaneous phase 4 depolarization and become an automatic pacemaker.
The bottom trace
in Plate 2-14, recorded from an ordinary muscle fiber of
the ventricle, is included to contrast the time of excitation and action-potential
duration with the other records.
SEQUENCE OF EXCITATION
AND THE ELECTROCARDIOGRAM
The seven tracings
of transmembrane action potentials indicate the normal sequence of heart activation
in relation to the schematic electrocardiogram (ECG) shown below them. The coloring
of the ECG trace suggests the temporal relationship of each type of action potential
to the normal ECG, as well as the contribution of electrical activity in each type
of cell to the ECG recorded from the body surface.
Activity of pacemaker
fibers in the SA node precedes the first indication of activity in the ECG (the
P wave) and cannot be demonstrated in the body-surface leads. Depolarization of
atrial muscle fibers, in a sequence largely determined by the specialized atrial
paths shown, causes the P wave. Repolarization of atrial fibers ordinarily is not
seen in the surface ECG. Activity reaches the upper part of the A-V node early during
the P wave. Propagation through the node is slow, and excitation of fibers in the
His bundle does not occur until the middle of the P-R interval. The spread of activity
through the common bundle, the bundle branches, and parts of the Purkinje system
precedes the earliest excitation of ventricular muscle. There is no indication in
the surface ECG of excitation of the fibers of the His-Purkinje system. The QRS
complex results from activation of the muscle fibers of the ventricles. The isoelectric
S-T segment corresponds to the plateau of the ventricular action potential, and
the T wave results from repolarization of ventricular fibers. The U wave corresponds
in time with repolarization of the specialized fibers of the bundle branches and
Purkinje system and may reflect this event as recorded at the body surface.
Although the normal sequence of heart activation results from the anatomic distribution and unique electrical properties of specialized cardiac cells, no signal recorded in the ECG corresponds to these events. Thus the sequence of excitation of the specialized tissues can be determined only by implication when noting the temporal characteristics of the P wave and QRS complexes and their interrelationships. Further, since excitation and the resulting depolarization cause contraction of the myocardial fibers, the coordinated mechanical activity of the heart depends on the specialized cardiac fibers.


